DesertWeather.com logo

DesertWeather.com

Live weather information for the Coachella Valley
Thousand Palms, California

Desert Weather Guesser - guess the weather, win bragging rights. Play free.
Thousand Palms, California
77
°F
Colder 0.3°F than last hour.
Mild — partly cloudy
Feels like 78.1°F  ·  This time yesterday: 84°F
Past 2 Hours ● -1.2°F
74.7° 78.4°
2hr ago 60m Now
78
Today’s High
1:16 PM
91°
Yesterday’s High
12:58 PM
67
Today’s Low
1:24 AM
68°
Yesterday’s Low
11:59 PM
Updated: 2:29:00 pm PDT
Humidity
53 %
24h diff 13%
Hi 90% 6:10 AM
Lo 51% 1:14 PM
Dew Point
57 °F
24h diff 0°F
Hi 65° 7:46 AM
Lo 56° 2:12 PM
Wind
N2 mph
Gust 4.0 mph
Top gust 18.4 mph (12:35 AM)
Cloud Height / Wind
4364 ft
10m avg 3.8 mph
Hour top gust 13 mph NNE
Wind Run  mi
Barometer
29.60 in
Steady  ·  24h diff 0.09
Hi 29.61 1:04 PM
Lo 29.25 1:04 AM
Solar
330 wm
50% of max
Daylight 11:30 hr
High Solar 1030 wm
Max Temp for this Date
101 °F
2024 · (This Station · Since 2004)
Min Temp for this Date
54 °F
2019 · (This Station · Since 2004)
This time yesterday
84 °F
-6.7° vs now
Record high (this date)
110 °F
1951 · (Palm Springs Airport)
Rain today
1.13 in
Rate: 0.000 in/hr
Yesterday
0.31  in
Storm: 1.44 in
October
1.44 in
Last rain: 10/11/2026
Cal year
2.49 in
0 days since rain
Water year
1.44 in
Oct.’25 – Sep.’26
Max rain rate: 3.429 (1:17 AM)
CWOP: CW2285  ·  WU: KCATHOUS8
NWS verified rain gauge
6 UV  ·  High  ·  Oct 11
Live data from sensors installed in Thousand Palms, CA  ·  Rain verified by NWS Standard Rain Gauge

GRAPHS, LAST 3 HOURS:

Temperature °F75.6
▼ Last hour: -1.6 °F
73.8°78.4°
3hr ago90mNow
Dew Point °F5m avg57.0
▼ Last hour: -1.8 °F
56.2°63.0°
3hr ago90mNow
Avg Wind Speed mph10m avg2.3
▲ Last hour: +0.2 mph
0.07.1
3hr ago90mNow
Wind Gust mph5.0
▼ Last hour: -2.0 mph
0.013.0
3hr ago90mNow
Humidity %5m avg52
▲ Last hour: +1 %
5268
3hr ago90mNow
Barometer inHg5m avg29.60
● Last hour: +0.00 inHg
29.5829.61
3hr ago90mNow
Solar W/m²330
▼ Last hour: -22 W/m²
1231,030
2hr ago60mNow
Rain in1.13
● Last hour: +0.00 in
3hr ago90mNow


Wind Advisory  WIND ADVISORY   Wind Advisory
COACHELLA VALLEY

Areas Affected:
Coachella Valley
This Notice Updated: Sun, 10/11 1:22pm Updated: Sun, 10/11 2:18pm Urgency: Expected
Next Update: Sun, 10/11 10:15pm Severity:  Moderate  Certainty: Likely

 
Details:
* WHAT...West winds 20 to 30 mph with gusts up to 45 mph expected.

* WHERE...Coachella Valley.

* WHEN...Until 5 AM PDT Monday.

* IMPACTS...Gusty winds will blow around unsecured objects. Tree
limbs could be blown down and a few power outages may result.

Information:
Winds this strong can make driving difficult, especially for high
profile vehicles. Use extra caution.

NWS Weather Alerts

Issued by the National Weather Service

warnings updated: Sunday, October 11, 2026, 2:18 pm PDT


Hyperlocal Radar, only active during weather events


LATEST IMAGE SHOWN HERE, FOR THE LAST HOUR ANIMATION CLICK ON THE IMAGE BELOW.Hyper-local Radar
image updated: October 11, 2026, 2:28 pm PDT


Hourly Forecast for Select Locations

Forecast Source: National Weather Service

Forecast generated: Sun Oct 11, 11:12 AM PDT     Last checked: Sun Oct 11, 12:00 PM PDT
Temperature, °F
Temperature, °F chart.
Dew point, °F
Dew point, °F chart.
Sky cover, %
Sky cover, % chart.
Probability of precipitation, %
Probability of precipitation, % chart.
Precip. amount, in
Precipitation, in Total accumulation, in
Precip. amount, in chart.


Record Watch

Data: NWS - Palm Springs (KPSP)


Rain Climatology

Rainfall data: Thousand Palms, CA(DesertWeather.com) / Climate data: DesertWeather.com - Averaged data, last 25 years. Archived gauges displayed HERE.

October 1-11

Observed Rainfall: 1.44 in.
Normal Rain for October 1-11: 0.01 in.

Departure from Normal: above  1.43 in.
Jan 1 to October 11, 2026

Observed Rainfall: 2.49 in.
Normal Rain for Jan 1 to Oct 11, 2026: 2.48 in.

Departure from Normal: above  0.01 in.
Water Year: Oct 2025 to Sep 2026

Observed Rainfall: 1.44 in.
Normal Rain for Oct 1 to Oct 11, 2026: 0.01 in.

Departure from Normal: above  1.43 in.


Webcam image TP1 Webcam image TP2 Webcam image RM


Weathercams - Sunset Gallery - Click Here


Almanac

Almanac information is for the Palm Springs Airport and is provided by the National Weather Service.

High 93° normal 110° record (1951)
Low 66° normal 38° record (1924)
Sunrise 6:49am
Sunset 6:18pm
Moonrise 7:52am
Moonset 6:39pm
Moon phase
Illumination 1%
Fire danger gauge
Sun and moon position chart


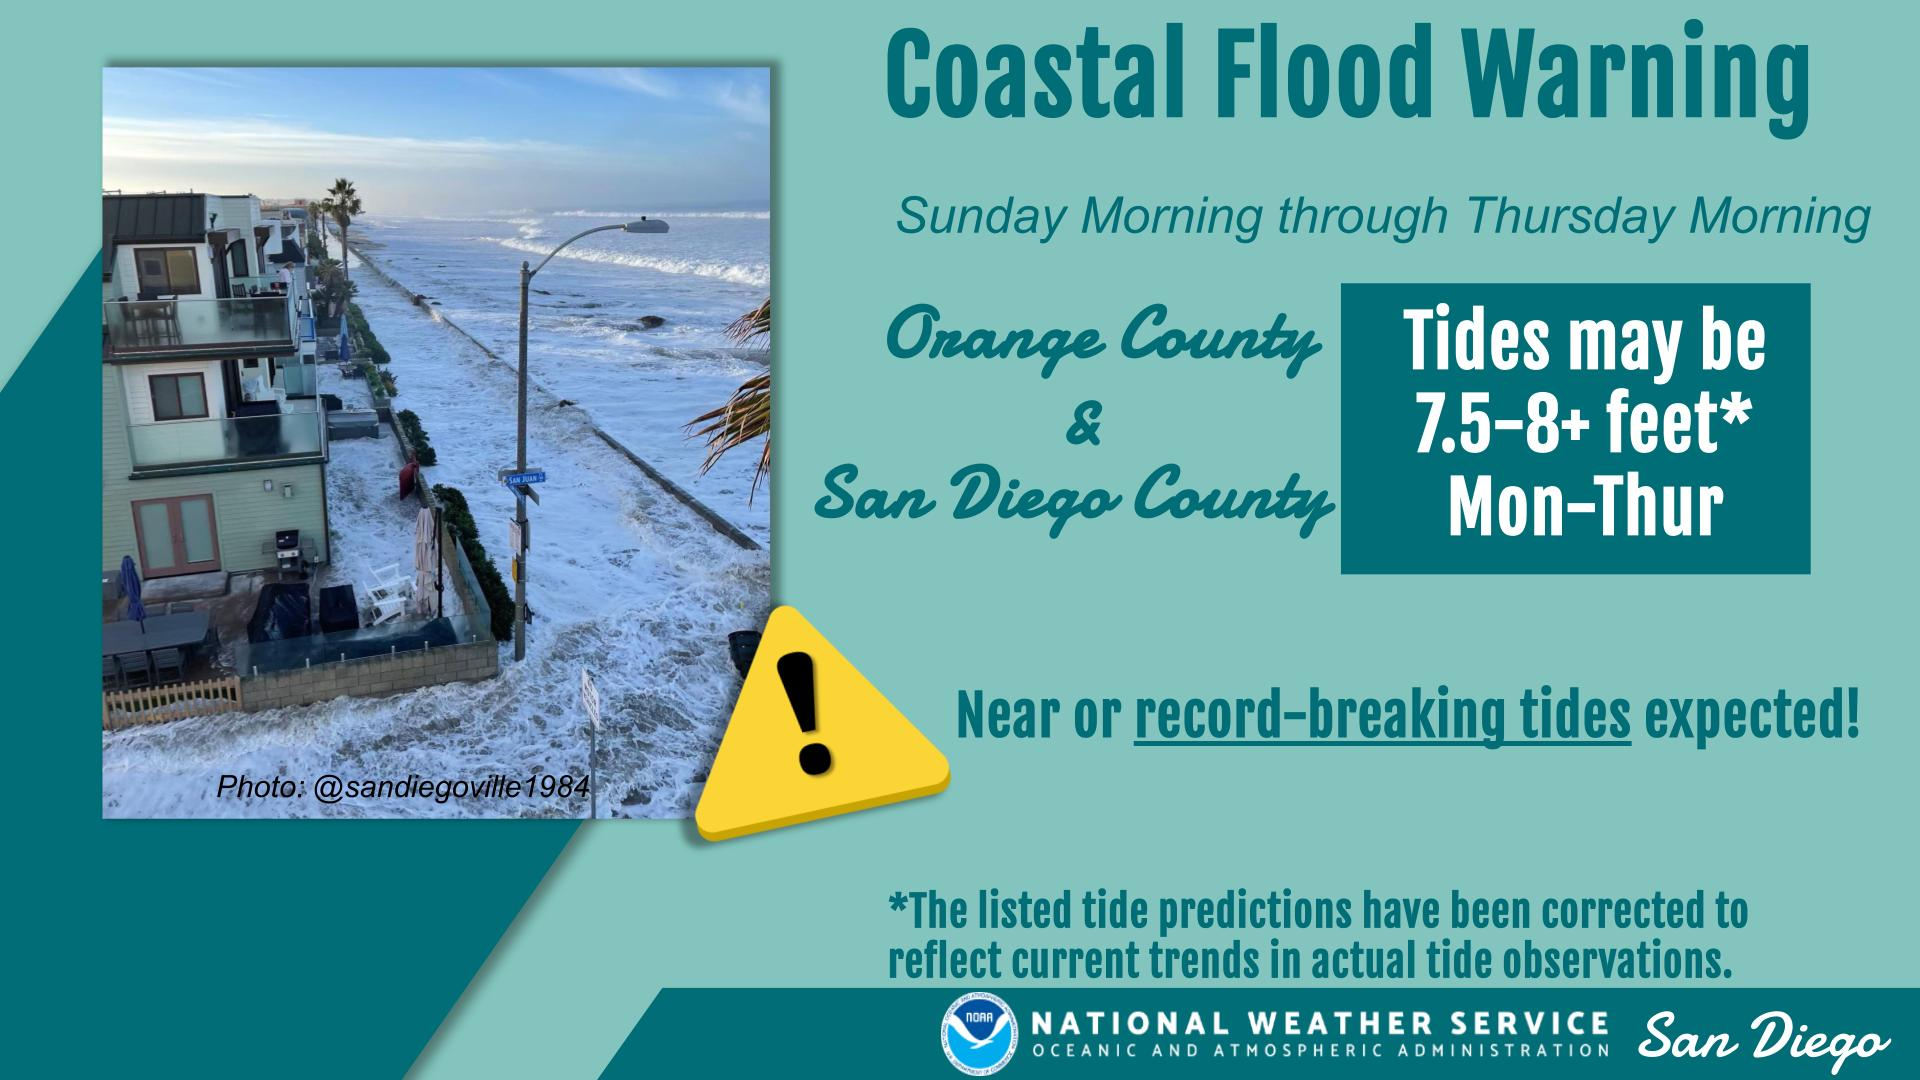
WEATHER STORY
San Diego
Weather Forecast Office
Rain Forecast through Monday Peak Wind Gusts High Elevation Mountain Snow
Open WFO in new window/tab
Forecast totals for the coast:0.10-0.20", valleys: 0.10-0.30", mountains: 0.50-1 inch, and less than 0.10" for the deserts.

Data Courtesy of San Diego Weather Forecast Office


Evaporative Cooler Effectiveness by City


Thousand Palms
POOR IDEAL Evap Cooler Effectiveness Marginal Score 38/100 · 11°F wet-bulb depression
Outside Temp 76°F
Dew Point 58°F
Est. Output 67°F
Updated: Oct 11, 2:29 PM PDT
Palm Desert (Hwy 111 & El Paseo)
POOR IDEAL Evap Cooler Effectiveness Fair Score 42/100 · 13°F wet-bulb depression
Outside Temp 77°F
Dew Point 57°F
Est. Output 66°F
Updated: Oct 11, 2:26 PM PDT
Palm Springs Airport
POOR IDEAL Evap Cooler Effectiveness Fair Score 43/100 · 13°F wet-bulb depression
Outside Temp 75°F
Dew Point 54°F
Est. Output 65°F
Updated: Oct 11, 1:53 PM PDT
Thermal Airport
POOR IDEAL Evap Cooler Effectiveness Marginal Score 38/100 · 11°F wet-bulb depression
Outside Temp 76°F
Dew Point 58°F
Est. Output 67°F
Updated: Oct 11, 1:52 PM PDT

How to Read This

Score

0–100, based on the wet-bulb depression — how much cooler the air could get versus the actual outside temperature. Drier air means more room to cool, so a bigger gap scores higher.

Wet-Bulb Depression

The gap between the outside (dry-bulb) temperature and the wet-bulb temperature — the coolest evaporation alone could get the air. A bigger gap means drier air and more room for the cooler to work with.

Estimated(Est.) Output

The approximate temperature of the air coming out of the cooler, estimated by cooling the outside temperature most of the way toward the wet-bulb temperature.

Efficiency

These numbers assume 80% saturation efficiency — typical for a well-maintained direct (single-stage) evaporative cooler.

Lower dew point + higher temp = better cooling


(This guide generally will work for misting systems also)


DesertWeather.com