Areas Affected: Coachella Valley - San Diego County Deserts - San Gorgonio Pass Near Banning
This Notice Updated: Fri, 10/9 2:59am
Updated: Fri, 10/9 2:48pm
Urgency: Expected
Next Update: Fri, 10/9 11:00am
Severity: Severe
Certainty: Likely
Details:
* WHAT...Dangerously hot conditions with temperatures up to 105.

* WHERE...Coachella Valley, San Diego County Deserts, and San
Gorgonio Pass near Banning.

* WHEN...Until 8 PM PDT this evening.

* IMPACTS...Heat related illnesses increase significantly during
extreme heat events.
Information:
Drink plenty of fluids, stay in an air-conditioned room, stay out of
the sun, and check up on relatives and neighbors.

Take extra precautions when outside. Wear lightweight and loose
fitting clothing. Try to limit strenuous activities to early morning
or evening. Take action when you see symptoms of heat exhaustion and
heat stroke.
NWS Weather Alerts
Issued by the National Weather Service
FLOOD WATCH
COACHELLA VALLEY
Areas Affected: San Diego County Coastal Areas - San Diego County Inland Valleys - San Bernardino County Mountains - Riverside County Mountains - San Diego County Mountains - Apple and Lucerne Valleys - Coachella Valley - San Diego County Deserts - San Gorgonio Pass Near Banning
This Notice Updated: Fri, 10/9 12:16pm
Updated: Fri, 10/9 2:48pm
Urgency: Future
Next Update: Fri, 10/9 10:30pm
Severity: Severe
Certainty: Possible
Details:
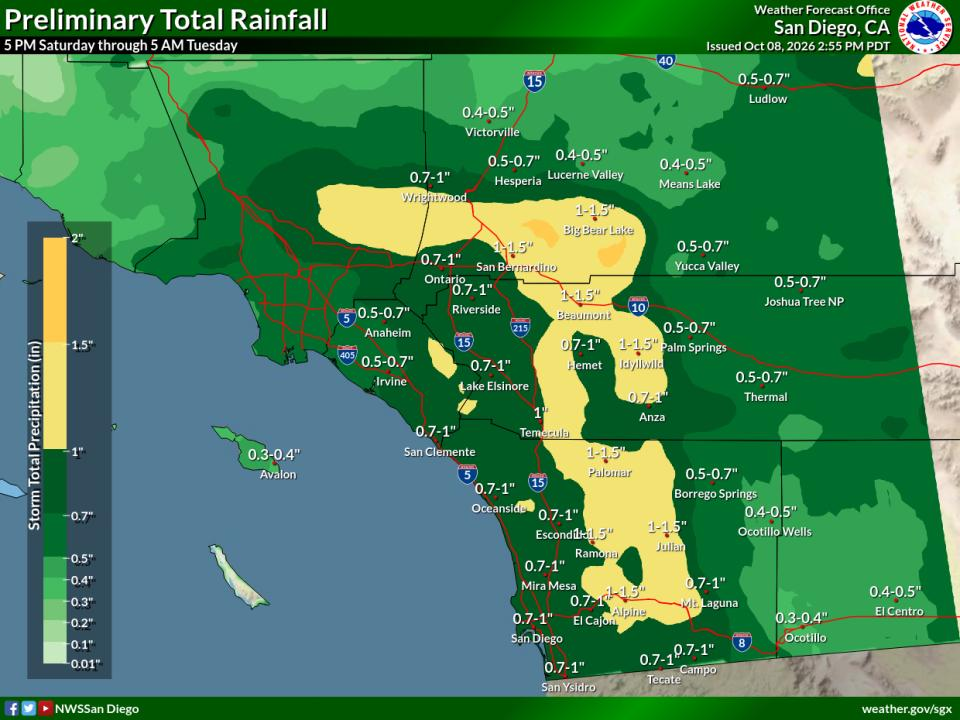
* WHAT...Flooding caused by excessive rainfall is possible.

* WHERE...A portion of Southwest California, including the following
areas, Apple and Lucerne Valleys, Coachella Valley, Riverside
County Mountains, San Bernardino County Mountains, San Diego County
Coastal Areas, San Diego County Deserts, San Diego County
Mountains, San Diego County Valleys and San Gorgonio Pass near
Banning.

* WHEN...From Saturday evening through Sunday evening.

* IMPACTS...Excessive runoff may result in flooding of rivers,
creeks, streams, and other low-lying and flood-prone locations.

* ADDITIONAL DETAILS...
- Tropical Storm Rachel will bring periods of moderate to heavy
rain to all of San Diego County, Riverside County mountains and
deserts, and San Bernardino County mountains and deserts. Maximum
hourly rainfall rates of 0.50 to 0.60 inches per hour are
possible for San Diego Coast and Valleys. Maximum hourly rainfall
rates of 0.50 to 0.70 inches per hour are possible across area
deserts and 0.70 to 1 inch per hour rates are possible across
area mountains. Heaviest rainfall is most likely late Saturday
night through Sunday afternoon.
- https://www.weather.gov/safety/flood
Information:
You should monitor later forecasts and be alert for possible Flood
Warnings. Those living in areas prone to flooding should be prepared
to take action should flooding develop.
Rainfall chances increase Saturday night, with widespread rain expected on Sunday. There still remains some uncertainty in the details of the rainfall forecast, but periods of moderate to locally heavy rain are possible on Sunday especially in the mountains and deserts. Another low pressure system from the northwest will continue rainfall chances Monday into Tuesday. This rain is expected to be lighter and more scattered in coverage. Dry conditions will return by Wednesday.
Data Courtesy of San Diego Weather Forecast Office
Evaporative Cooler Effectiveness by City
Thousand Palms
Outside Temp101°F
Dew Point53°F
Est. Output77°F
Updated: Oct 9, 2:59 PM PDT
Palm Desert (Hwy 111 & El Paseo)
Outside Temp102°F
Dew Point55°F
Est. Output78°F
Updated: Oct 9, 2:52 PM PDT
Palm Springs Airport
Outside Temp104°F
Dew Point49°F
Est. Output77°F
Updated: Oct 9, 2:53 PM PDT
Thermal Airport
Outside Temp104°F
Dew Point51°F
Est. Output78°F
Updated: Oct 9, 2:52 PM PDT
How to Read This
Score
0–100, based on the wet-bulb depression — how much cooler the air could get versus the actual outside temperature. Drier air means more room to cool, so a bigger gap scores higher.
Wet-Bulb Depression
The gap between the outside (dry-bulb) temperature and the wet-bulb temperature — the coolest evaporation alone could get the air. A bigger gap means drier air and more room for the cooler to work with.
Estimated(Est.) Output
The approximate temperature of the air coming out of the cooler, estimated by cooling the outside temperature most of the way toward the wet-bulb temperature.
Efficiency
These numbers assume 80% saturation efficiency — typical for a well-maintained direct (single-stage) evaporative cooler.
Lower dew point + higher temp = better cooling
(This guide generally will work for misting systems also)


 EXTREME HEAT WARNING
  FLOOD WATCH