DesertWeather.com logo

DesertWeather.com

Live weather information for the Coachella Valley
Thousand Palms, California

Desert Weather Guesser - guess the weather, win bragging rights. Play free.
Thousand Palms, California
81
°F
Colder 1.9°F than last hour.
Mild — mostly cloudy
Feels like 81.4°F  ·  This time yesterday: 102°F
Past 2 Hours ▼ -4.9°F
81.3° 86.2°
2hr ago 60m Now
91
Today’s High
12:58 PM
105°
Yesterday’s High
1:48 PM
81
Today’s Low
3:41 PM
86°
Yesterday’s Low
10:50 PM
Updated: 3:53:00 pm PDT
Humidity
44 %
24h diff 24%
Hi 50% 3:05 PM
Lo 22% 2:41 AM
Dew Point
57 °F
24h diff 5°F
Hi 62° 2:55 PM
Lo 43° 6:02 AM
Wind
WSW9 mph
Gust 11.0 mph
Top gust 28.0 mph (1:09 PM)
Cloud Height / Wind
5769 ft
10m avg 9.9 mph
Hour top gust 21 mph W
Wind Run  mi
Barometer
29.53 in
Steady  ·  24h diff -0.01
Hi 29.56 9:10 AM
Lo 29.49 12:44 PM
Solar
188 wm
43% of max
Daylight 11:33 hr
High Solar 445 wm
Max Temp for this Date
104 °F
2024 · (This Station · Since 2004)
Min Temp for this Date
50 °F
2013 · (This Station · Since 2004)
This time yesterday
102 °F
-20.5° vs now
Record high (this date)
108 °F
1991 · (Palm Springs Airport)
Rain today
0.00 in
Rate: 0.000 in/hr
Yesterday
0.00  in
Storm: 0.00 in
October
0.00 in
Last rain: 9/6/2026
Cal year
1.05 in
33 days since rain
Water year
0.00 in
Oct.’25 – Sep.’26
Max rain rate: 0.000 (00:00 AM)
CWOP: CW2285  ·  WU: KCATHOUS8
NWS verified rain gauge
6.3 UV  ·  High  ·  Oct 10
Live data from sensors installed in Thousand Palms, CA  ·  Rain verified by NWS Standard Rain Gauge

GRAPHS, LAST 3 HOURS:

Temperature °F81.3
▼ Last hour: -2.7 °F
81.3°90.7°
3hr ago90mNow
Dew Point °F5m avg58.0
▼ Last hour: -0.4 °F
48.8°61.0°
3hr ago90mNow
Avg Wind Speed mph10m avg7.7
▲ Last hour: +7.3 mph
0.016.0
3hr ago90mNow
Wind Gust mph12.0
▲ Last hour: +8.0 mph
0.028.0
3hr ago90mNow
Humidity %5m avg45
▲ Last hour: +4 %
2449
3hr ago90mNow
Barometer inHg5m avg29.53
● Last hour: +0.00 inHg
29.4929.55
3hr ago90mNow
Solar W/m²188
▲ Last hour: +90 W/m²
98250
2hr ago60mNow
Rain in0.00
● Last hour: +0.00 in
3hr ago90mNow


Wind Advisory  WIND ADVISORY   Wind Advisory
COACHELLA VALLEY

Areas Affected:
Coachella Valley
This Notice Updated: Sat, 10/10 11:31am Updated: Sat, 10/10 3:48pm Urgency: Expected
Next Update: Sat, 10/10 10:30pm Severity:  Moderate  Certainty: Likely

 
Details:
* WHAT...Southeast winds early Sunday will become west winds 10 to 20
mph with gusts 35 to 45 mph expected.

* WHERE...Coachella Valley.

* WHEN...From 2 AM Sunday to 5 AM PDT Monday.

* IMPACTS...Gusty winds will blow around unsecured objects. Tree
limbs could be blown down and a few power outages may result.

Information:
Winds this strong can make driving difficult, especially for high
profile vehicles. Use extra caution.

NWS Weather Alerts

Issued by the National Weather Service

Flood Watch  FLOOD WATCH   Flood Watch
COACHELLA VALLEY

Areas Affected:
San Diego County Coastal Areas - San Diego County Inland Valleys - San Bernardino County Mountains - Riverside County Mountains - San Diego County Mountains - Apple and Lucerne Valleys - Coachella Valley - San Diego County Deserts - San Gorgonio Pass Near Banning
This Notice Updated: Sat, 10/10 11:36am Updated: Sat, 10/10 3:48pm Urgency: Future
Next Update: Sat, 10/10 10:15pm Severity:  Severe  Certainty: Possible

 
Details:
* WHAT...Flooding caused by excessive rainfall continues to be
possible.

* WHERE...A portion of Southwest California, including the following
areas, Apple and Lucerne Valleys, Coachella Valley, Riverside
County Mountains, San Bernardino County Mountains, San Diego County
Coastal Areas, San Diego County Deserts, San Diego County
Mountains, San Diego County Valleys and San Gorgonio Pass near
Banning.

* WHEN...From 11 PM PDT this evening through Sunday evening.

* IMPACTS...Excessive runoff may result in flooding of rivers,
creeks, streams, and other low-lying and flood-prone locations.

* ADDITIONAL DETAILS...
- Tropical Storm Rachel will bring periods of moderate to heavy
rain to all of San Diego County, Riverside County mountains and
deserts, and San Bernardino County mountains and deserts. Maximum
hourly rainfall rates of 0.50 to 0.60 inches per hour are
possible for San Diego Coast and Valleys. Maximum hourly rainfall
rates of 0.50 to 0.70 inches per hour are possible across area
deserts and 0.70 to 1 inch per hour rates are possible across
area mountains. Heaviest rainfall is most likely late Saturday
night through early Sunday afternoon. Rainfall will taper off
from south to north Sunday. Lingering lighter showers are
expected to continue into Monday.
- https://www.weather.gov/safety/flood

Information:
You should monitor later forecasts and be alert for possible Flood
Warnings. Those living in areas prone to flooding should be prepared
to take action should flooding develop.

NWS Weather Alerts

Issued by the National Weather Service

warnings updated: Saturday, October 10, 2026, 3:48 pm PDT


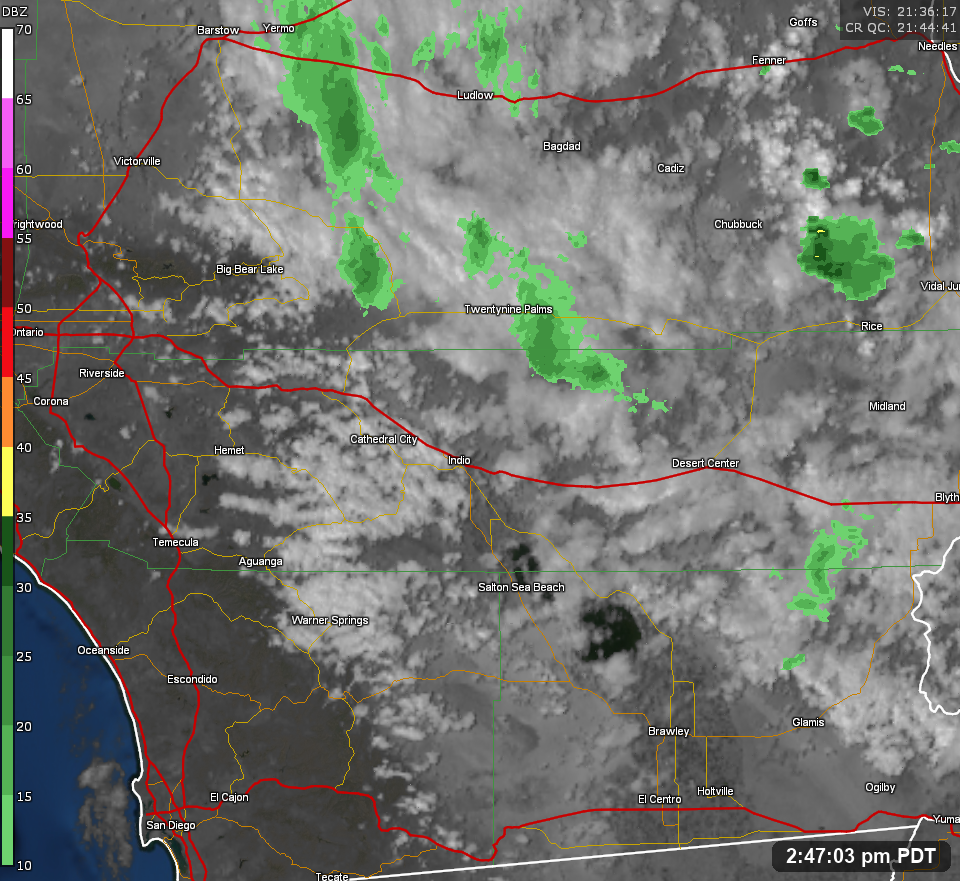
Hyperlocal Radar, only active during weather events


LATEST IMAGE SHOWN HERE, FOR THE LAST HOUR ANIMATION CLICK ON THE IMAGE BELOW.Hyper-local Radar
image updated: October 10, 2026, 3:48 pm PDT


Summer Moisture / Monsoon Watch. Hourly Forecast for Select Locations

Forecast Source: National Weather Service

Forecast generated: Sat Oct 10, 11:14 AM PDT     Last checked: Sat Oct 10, 11:57 AM PDT
Temperature, °F
Temperature, °F chart.
Dew point, °F
Dew point, °F chart.
Sky cover, %
Sky cover, % chart.
Probability of precipitation, %
Probability of precipitation, % chart.
Precip. amount, in
Precipitation, in Total accumulation, in
Precip. amount, in chart.


Record Watch

Data: NWS - Palm Springs (KPSP)


Rain Climatology

Rainfall data: Thousand Palms, CA(DesertWeather.com) / Climate data: DesertWeather.com - Averaged data, last 25 years. Archived gauges displayed HERE.

October 1-10

Observed Rainfall: 0.00 in.
Normal Rain for October 1-10: 0.01 in.

Departure from Normal: below  -0.01 in.
Jan 1 to October 10, 2026

Observed Rainfall: 1.05 in.
Normal Rain for Jan 1 to Oct 10, 2026: 2.48 in.

Departure from Normal: below  -1.43 in.
Water Year: Oct 2025 to Sep 2026

Observed Rainfall: 0.00 in.
Normal Rain for Oct 1 to Oct 10, 2026: 0.01 in.

Departure from Normal: below  -0.01 in.


Webcam image TP1 Webcam image TP2 Webcam image RM


Weathercams - Sunset Gallery - Click Here


Almanac

Almanac information is for the Palm Springs Airport and is provided by the National Weather Service.

High 93° normal 108° record (1991)
Low 67° normal 45° record (1930)
Sunrise 6:48am
Sunset 6:19pm
Moonrise 6:50am
Moonset 6:08pm
Moon phase
Illumination 0%
Fire danger gauge
Sun and moon position chart


WEATHER STORY
San Diego
Weather Forecast Office
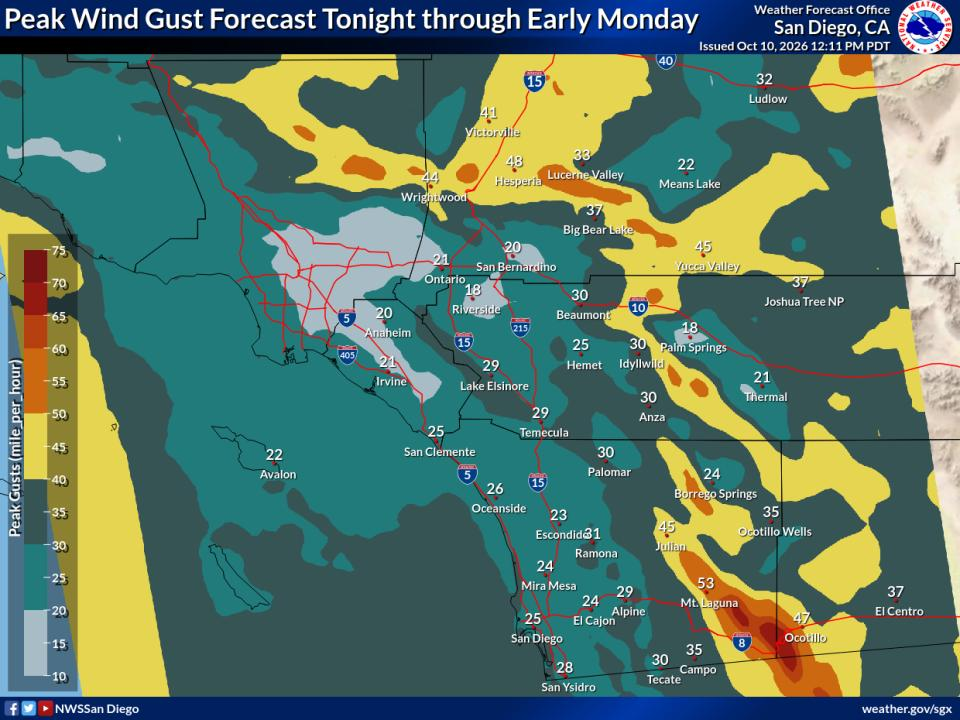
Rainfall Forecast for Sunday Wind Gusts Tonight into Sunday Additional Showers Mon-Tue Snow Mon-Tue
Open WFO in new window/tab

Gusty southwest to west winds expected across the area Sunday, except the winds will be southeasterly in the southeast portions of San Diego County early in the day. Preliminary forecast has wind gusts of 25 to 40 mph for the coastal waters, coast, and valleys, and 40 to 60 mph for the desert slopes of the mtns and into the deserts. Gusts near 70 mph through the San Gorgonio pass and other wind-prone east-facing slopes.

Data Courtesy of San Diego Weather Forecast Office


Evaporative Cooler Effectiveness by City


Thousand Palms
POOR IDEAL Evap Cooler Effectiveness Fair Score 50/100 · 15°F wet-bulb depression
Outside Temp 81°F
Dew Point 57°F
Est. Output 69°F
Updated: Oct 10, 3:53 PM PDT
Palm Desert (Hwy 111 & El Paseo)
POOR IDEAL Evap Cooler Effectiveness Fair Score 48/100 · 14°F wet-bulb depression
Outside Temp 82°F
Dew Point 60°F
Est. Output 71°F
Updated: Oct 10, 3:50 PM PDT
Palm Springs Airport
POOR IDEAL Evap Cooler Effectiveness Good Score 66/100 · 20°F wet-bulb depression
Outside Temp 85°F
Dew Point 52°F
Est. Output 69°F
Updated: Oct 10, 2:53 PM PDT
Thermal Airport
POOR IDEAL Evap Cooler Effectiveness Good Score 73/100 · 22°F wet-bulb depression
Outside Temp 89°F
Dew Point 53°F
Est. Output 72°F
Updated: Oct 10, 2:52 PM PDT

How to Read This

Score

0–100, based on the wet-bulb depression — how much cooler the air could get versus the actual outside temperature. Drier air means more room to cool, so a bigger gap scores higher.

Wet-Bulb Depression

The gap between the outside (dry-bulb) temperature and the wet-bulb temperature — the coolest evaporation alone could get the air. A bigger gap means drier air and more room for the cooler to work with.

Estimated(Est.) Output

The approximate temperature of the air coming out of the cooler, estimated by cooling the outside temperature most of the way toward the wet-bulb temperature.

Efficiency

These numbers assume 80% saturation efficiency — typical for a well-maintained direct (single-stage) evaporative cooler.

Lower dew point + higher temp = better cooling


(This guide generally will work for misting systems also)


DesertWeather.com